Satellite photo reveals a Fault line mapped in Turkey
More than 22,000 people are already confirmed dead, and an unknown number still lie trapped, with the window for their rescue closing rapidly.
And yet the science will go on. The insights gleaned from this event will save lives in the future.
Take a look at the map on this page. It is the most precise yet produced of how the ground lurched in response to the enormous energies unleashed.
The data behind it was acquired in the early hours of Friday by the European Union's Sentinel-1A satellite as it traversed north to south over Turkey at an altitude of 700km (435 miles).
The Sentinel carries a radar instrument that can sense the ground in all weather, day and night.
It routinely scans this earthquake-prone region of the world, tracing the often very subtle changes in elevation at the Earth's surface.
Of course, the changes on Monday were not subtle at all; they were dramatic. The ground bent, buckled and, in places, ripped apart.
Researchers use the technique of interferometry to compare "before" and "after" views. But you do not need to be an expert to see the consequences for Turkey in the latest Sentinel map.
The red colours describe the movement towards the satellite since it last flew over the country; the blue colours record the move away from the spacecraft.
It is abundantly clear how the ground has been deformed along and near the East Anatolian Fault line.
For both the Magnitude 7.8 quake that struck first on Monday at 01:17 GMT and the Magnitude 7.5 event at 10:24, the motion is "left-lateral". That is to say: whichever side of the fault you are on, the other side has moved to the left. And by several metres in places.
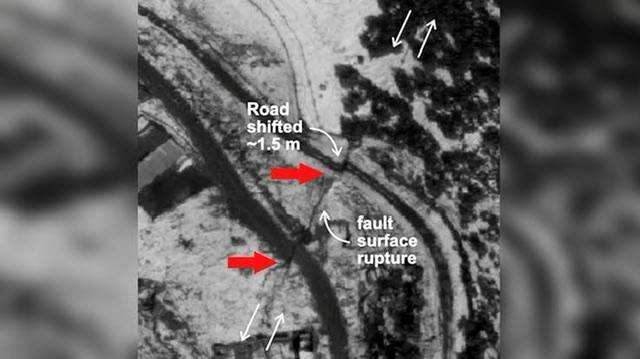
The shocking thing is that the lines of rupture have gone right through settlements; in lots of places they will have gone right through buildings.


0 Comment